SCB
Bo Werth
2017-07-09
SCB Statistics Sweden
Statistics Sweden Data
baseURL <- "http://api.scb.se/OV0104/v1/doris/en/ssd"
## flow <- "NR0103ENS2010T08A"
## path <- as.character(scb_tables$Path[scb_tables$ID==flow])
flow <- "LE0101F73"
path <- "LE/LE0101/LE0101F"
req.uri <- file.path(baseURL, path, flow)
bottom_node <- pxweb::get_pxweb_metadata(req.uri)
dims <- pxweb::get_pxweb_dims(bottom_node)
## dims_list <- as.list(rep("*", length(names(dims))))
## names(dims_list) <- names(dims)
dims_list <- lapply(dims, function(x) sample(x$values, min(length(x$values), 3)))
pxweb_data <-                           # retrieve data
  pxweb::get_pxweb_data(
           url = req.uri,
           dims = dims_list,
           clean = TRUE)
knitr::kable(pxweb_data[1:10,])| type of activity | how often during the last 12 months | level of education | sex | period | observations | values |
|---|---|---|---|---|---|---|
| used the Internet in spare time to search for something, download things, look at pictures or listen to music | a few times a month | total | men and women | 2008-2009 | Proportion of persons in percent | 3.6 |
| used the Internet in spare time to search for something, download things, look at pictures or listen to music | a few times a month | total | men and women | 2010-2011 | Proportion of persons in percent | 2.7 |
| used the Internet in spare time to search for something, download things, look at pictures or listen to music | a few times a month | total | men and women | 2012-2013 | Proportion of persons in percent | 2.8 |
| used the Internet in spare time to search for something, download things, look at pictures or listen to music | a few times a month | total | men and women | 2008-2009 | Estimated numbers in thousands | 277.0 |
| used the Internet in spare time to search for something, download things, look at pictures or listen to music | a few times a month | total | men and women | 2010-2011 | Estimated numbers in thousands | 207.0 |
| used the Internet in spare time to search for something, download things, look at pictures or listen to music | a few times a month | total | men and women | 2012-2013 | Estimated numbers in thousands | 223.0 |
| used the Internet in spare time to search for something, download things, look at pictures or listen to music | a few times a month | total | men and women | 2008-2009 | Margin of error, Estimated numbers in thousands | 24.0 |
| used the Internet in spare time to search for something, download things, look at pictures or listen to music | a few times a month | total | men and women | 2010-2011 | Margin of error, Estimated numbers in thousands | 22.0 |
| used the Internet in spare time to search for something, download things, look at pictures or listen to music | a few times a month | total | men and women | 2012-2013 | Margin of error, Estimated numbers in thousands | 24.0 |
| used the Internet in spare time to search for something, download things, look at pictures or listen to music | a few times a month | total | men | 2008-2009 | Proportion of persons in percent | 2.9 |
library(ggplot2)

unique(pxweb_data$observations)
## [1] Proportion of persons in percent
## [2] Estimated numbers in thousands
## [3] Margin of error, Estimated numbers in thousands
## 3 Levels: Estimated numbers in thousands ...## unique(pxweb_data$`type of activity`)
## dput(unique(pxweb_data$`how often during the last 12 months`))
data_plot <- pxweb_data
data_plot$`how often during the last 12 months` <-
factor(data_plot$`how often during the last 12 months`,
levels =
## c(
## "not at all",
## "a few times during the last three months or less often",
## "every day (by and large)"
## )
## c(
## "a few times during the last three months or less often",
## "every week but not every day",
## "several times a week or every day"
## )
c(
"not at all",
"several times a week or every day",
"every day (by and large)"
)
)
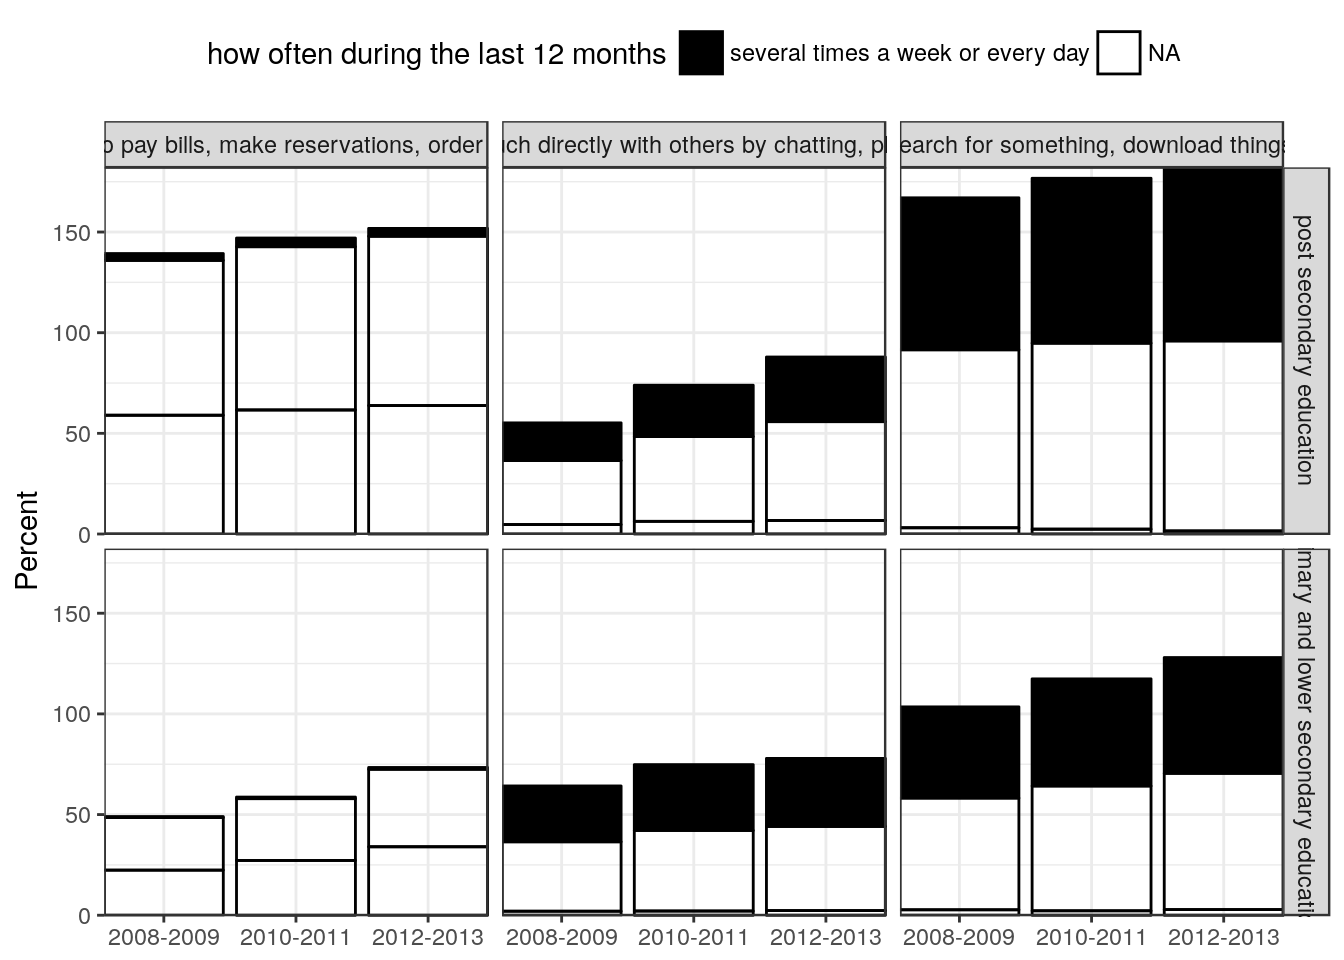
p <-
data_plot %>%
filter((sex %in% c("men and women"))) %>%
filter(!(`level of education` %in% c("total"))) %>%
## filter(observations %in% c("Estimated numbers in thousands")) %>%
filter(observations %in% c("Proportion of persons in percent")) %>%
ggplot(aes(x = period, y = values, fill = `how often during the last 12 months`)) +
## geom_point() +
geom_bar(position = "stack", stat = "identity", color = "black") +
facet_grid(`level of education` ~ `type of activity`) +
scale_fill_manual(values = c("black", "transparent", "#F92672")) +
scale_x_discrete(name = NULL, expand = c(0,0)) +
scale_y_continuous(name = "Percent", expand = c(0,0)) +
theme_bw() +
theme(legend.position = "top")
p