Statistics Norway Data
baseURL <- "http://data.ssb.no/api/v0"
## flow <- "OrgsatEksUlonn"
## req_uri <- as.character(ssb_tables$Statistic[ssb_tables$ID==flow])[1]
## flow <- "SnusUtdKj"
req_uri <- "http://data.ssb.no/api/v0/en/table/he/he03/royk/SnusUtdKj"

## req_uri <- file.path(baseURL, path, flow)
bottom_node <- pxweb::get_pxweb_metadata(req_uri)
dims <- pxweb::get_pxweb_dims(bottom_node)
## dims_list <- as.list(rep("*", length(names(dims))))
## names(dims_list) <- names(dims)
dims_list <- lapply(dims, function(x) sample(x$values, min(3, length(x$values))))
pxweb_data <-                           # retrieve data
  pxweb::get_pxweb_data(
           url = req_uri,
           dims = dims_list,
           clean = TRUE)
knitr::kable(pxweb_data[1:10,])
| Both sexes |
Below upper secondary level |
2012 |
Takes snuff daily (per cent) |
12 |
| Both sexes |
Below upper secondary level |
2014 |
Takes snuff daily (per cent) |
14 |
| Both sexes |
Below upper secondary level |
2015 |
Takes snuff daily (per cent) |
15 |
| Both sexes |
Below upper secondary level |
2012 |
Takes snuff occasionally (per cent) |
6 |
| Both sexes |
Below upper secondary level |
2014 |
Takes snuff occasionally (per cent) |
6 |
| Both sexes |
Below upper secondary level |
2015 |
Takes snuff occasionally (per cent) |
6 |
| Both sexes |
Tertiary education |
2012 |
Takes snuff daily (per cent) |
7 |
| Both sexes |
Tertiary education |
2014 |
Takes snuff daily (per cent) |
6 |
| Both sexes |
Tertiary education |
2015 |
Takes snuff daily (per cent) |
7 |
| Both sexes |
Tertiary education |
2012 |
Takes snuff occasionally (per cent) |
3 |
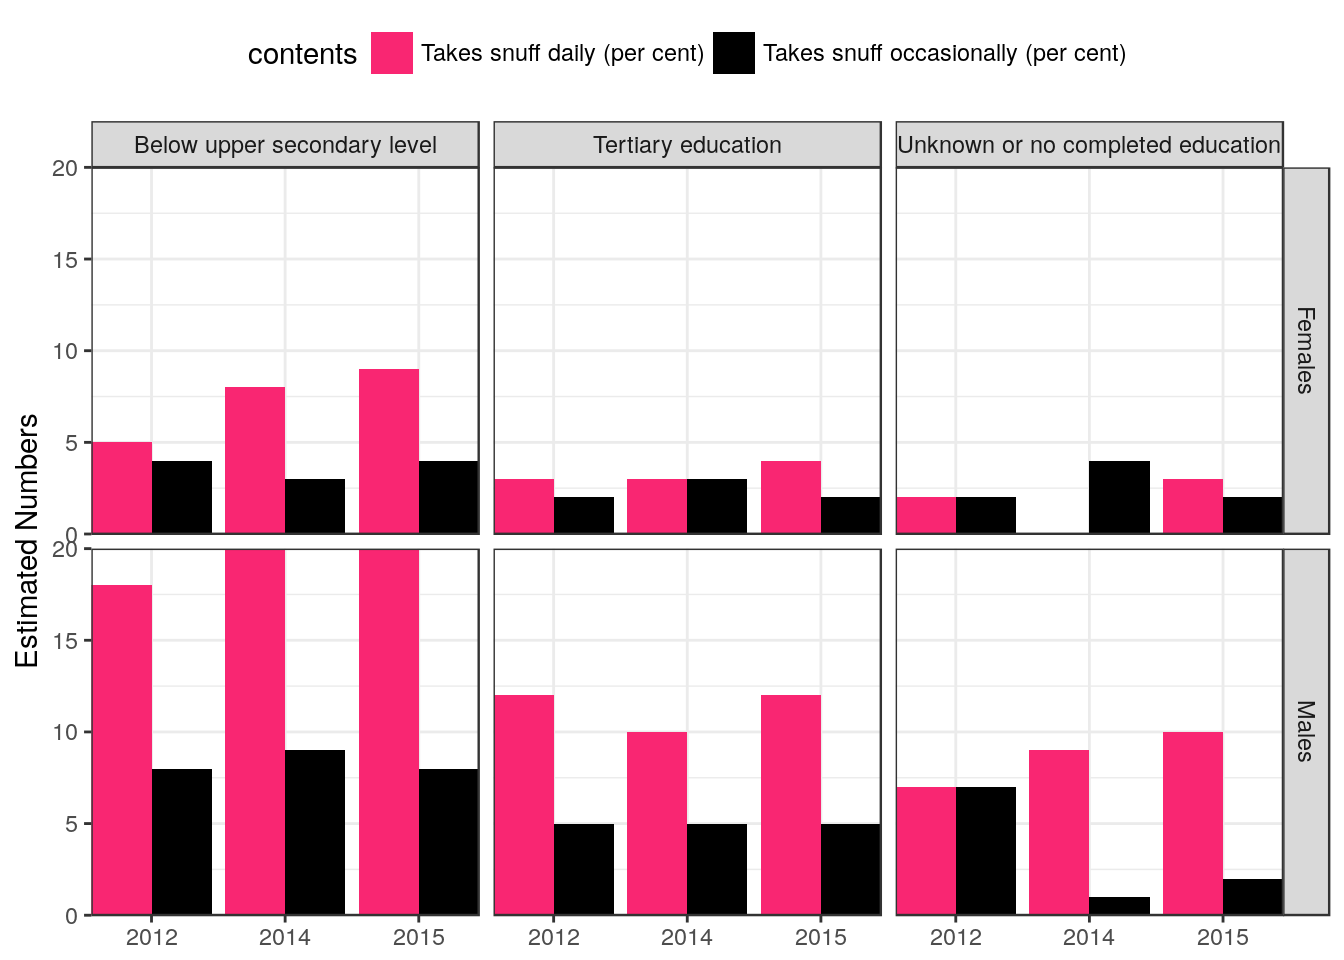
library(ggplot2)

## unique(pxweb_data$`type of activity`)
## unique(pxweb_data$`level of education`)
## dput(unique(pxweb_data$`how often during the last 12 months`))
## str(pxweb_data)
data_plot <- pxweb_data

## data_plot$`how often during the last 12 months` <-
##   factor(data_plot$`how often during the last 12 months`,
##          levels = c(
##            "not at all",
##            "a few times during the last three months or less often",
##            "every day (by and large)"
##          ))

p <-
  data_plot %>%
  filter(!(sex %in% c("Both sexes"))) %>%
  ## filter(!(`level of education` %in% c("total"))) %>%
  ## filter(observations %in% c("Estimated numbers in thousands")) %>%
  ggplot(aes(x = year, y = values, fill = contents)) +
  ## geom_point() +
  geom_bar(position = "dodge", stat = "identity") +
    ## facet_grid(`level of education` ~ `sex`) +
    facet_grid(sex ~ `level of education`) +
  scale_fill_manual(values = c("#F92672", "black")) +
scale_x_discrete(name = NULL, expand = c(0,0)) +
  scale_y_continuous(name = "Estimated Numbers", expand = c(0,0)) +
  theme_bw() +
  theme(legend.position = "top")
p
## Warning: Removed 1 rows containing missing values (geom_bar).